Donald Trump won the 2016 presidential election, but he didn’t win the election. Hillary Clinton scored an own-goal – she turned out the lowest share of voters of any Democrat since 1996, and was bested (in vote share) by numerous losing Democrats of the past. See fine candidates of the past like Kerry, John, and Gore, Al. Contrary to much current analysis, Donald Trump didn’t really expand his base – he performed about as well as a generic Republican, while Clinton under-performed badly. The CNN chart below shows candidates’ share of eligible voters since 1996 [1]:
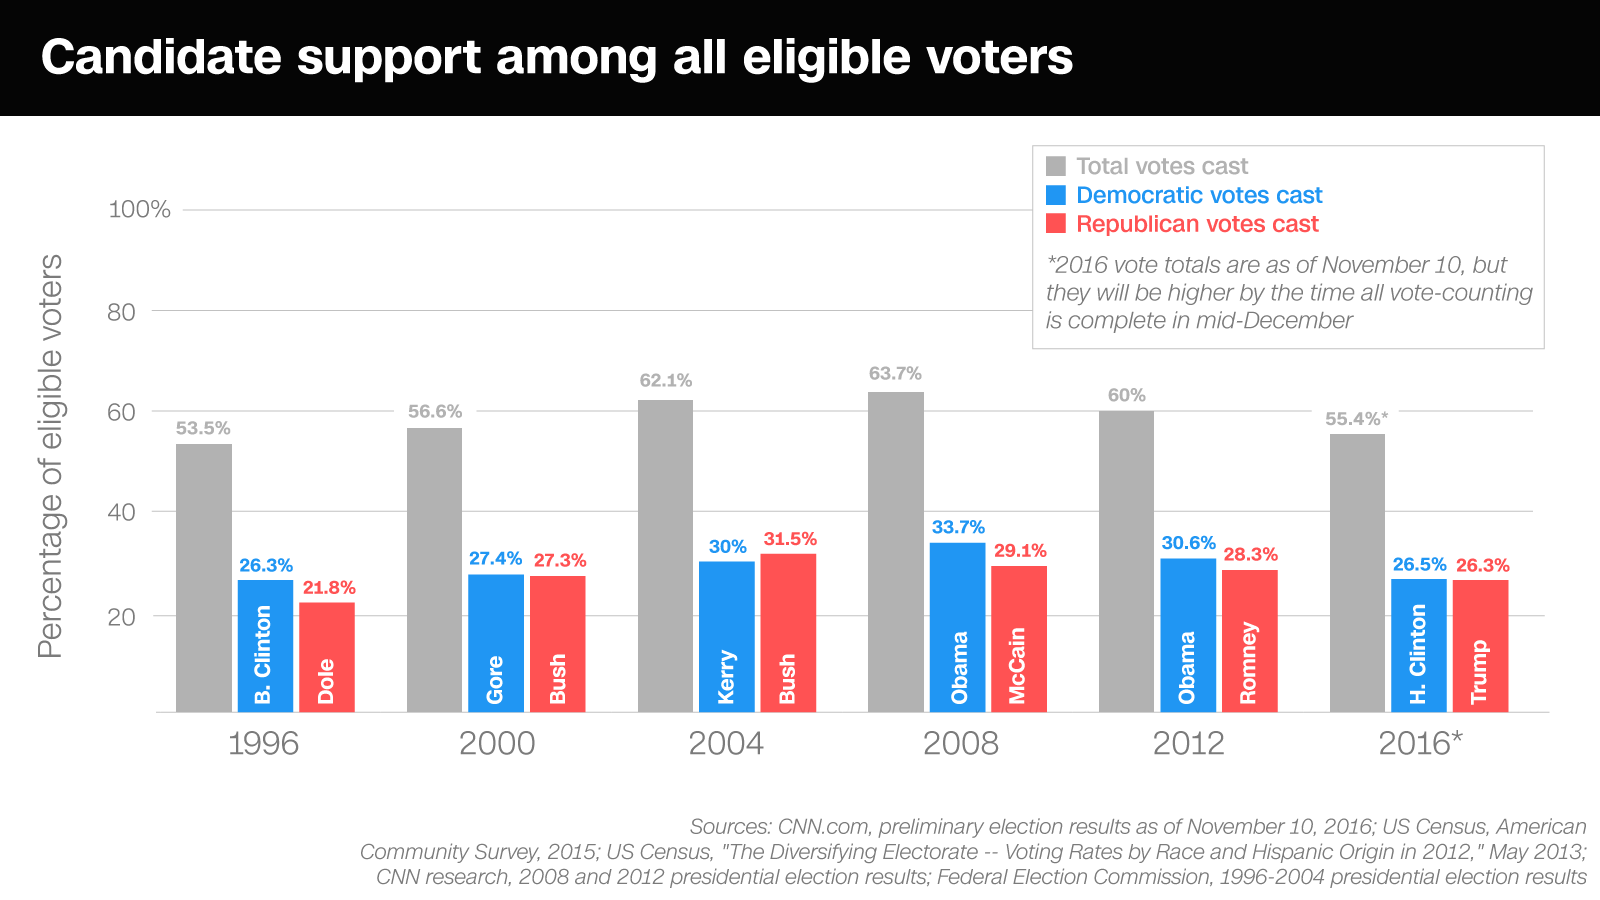
- GOP vote share peaked in 2004 and has been bleeding down steadily, losing about 1.7% in total vote share per election since 2004 [2]. Trump actually under-performed this downtrend, as he dropped 2% (from 28.3 to 26.3) versus the average drop of 1.7% per cycle for Republicans. The GOP seems to turn their base voters out steadily, but this base forms a shrinking percentage of the electorate as the US becomes more diverse.
- Democratic vote share has been more volatile, reaching a peak in 2008 and bleeding down after. But Clinton didn’t need to match Obama’s 2008 or 2012 performance to win – matching John Kerry or even Al Gore would have been sufficient! John Kerry’s performance, at 30% of eligible voters, would have crushed Trump, while even Al Gore’s 27.4% would have provided the small margin needed in the Midwest to win the election. In a low turnout election, Clinton bled off roughly 4% points of vote share, while Trump bled off only 2% points, leading to his narrow electoral college win.
- Neither 3rd party votes [3] nor Trump’s numbers explain Clinton’s collapse – Clinton and the Democratic party have only themselves to blame for frittering away more than 100% of Obama’s net gains! Democrats tend to win when they increase overall turnout, and the data show clearly that turnout collapsed in the 2016 election.
- Had Hillary Clinton managed to turn out any of the urban vote in the Midwest, or gotten millennials excited, she’d have been fine. She did neither, and in absolute terms had the worst performance for a Democrat since her husband, ironically (who won handily in 1996 in a low turnout election).
In short, I blame Democrats and the Clinton team in particular for this loss far more than I credit Donald Trump. According to the data, he likely performed just below a more typical GOP candidate, while Clinton greatly under-performed the last four Democratic campaigns.
Silver Linings For Democrats:
- Arizona is rapidly trending blue – more rapidly than expected. Obama lost Arizona by around 213,000 votes in 2012, while Clinton lost by only 85,000 votes in 2016. This aligns with a 2014 study on demographic change, putting it right on track to lean blue in 2020.
- Winning just Arizona’s and Florida’s (whose demographics are also shifting) 40 electoral votes replaces all the rust-belt states Clinton lost, creating a 272 electoral vote win.
- Who voted in 2008 that didn’t turn out in 2016? Young people and minorities. Democrats win when turnout is high. Turnout is high when the most progressive parts of the Democratic base are excited. Therefore, Democrats’ direction should be clear – there is no one left in the center, and it’s time to move forward with the progessive wing of the party.
- Had Democrats won in 2016, winning again (four in a row) would have proven even more impossible given the tick-tock nature of the Presidency in the US. Since FDR, one party has won three straight presidential contests only once, in 1988 – and none have won four straight.
[1] Votes are still being counted, and the final tally will likely show Clinton’s vote share edge close to 27%, still below Al Gore’s 2000 performance.
[2] Per the chart above, McCain lost 2.4% points from Bush 2004, and Romney lost another 0.8% points from McCain. Trump lost roughly 2% points from Romney – leading to an average decline rate of just over 1.7% per election cycle. Mr. Trump lost more than this amount, leading to the conclusion that he might have under-performed relative to an “average” GOP candidate.
[3] Above, we see that in 2016 voter turnout was around 55.4%, with 52.8% captured by the two mainstream parties. If all 2.6% lost to third parties came from Clinton voters (and it almost certainly dd not), that still implies that she under-performed Obama 2012 and Kerry 2004 by around a percentage point – and this assumption is far too generous to Clinton.
