Countries By Peak Oil Date – 2011 Data Update

In 2009 I wrote a post in which I compiled a comprehensive list of the world’s oil producing nations by peak-oil status, based on BP’s annually-released Statistical Review of World Energy. I’ve updated that list here using the data released in 2011, which includes production data through 2010. The new list shows that several more countries have either passed peak production or are currently stuck on a production plateau. Here is the data:

Country Peak Prod % Off Peak 2010 Prod Peak Yr
US 11,297 -33.5% 7,513 1970
Venezuela 3,754 -34.2% 2,471 1970
Other Middle East 79 -52.2% 38 1970
Libya 3,357 -50.6% 1,659 1970
Kuwait 3,339 -24.9% 2,508 1972
Iran 6,060 -30.0% 4,245 1974
Romania 313 -71.5% 89 1976
Indonesia 1,685 -41.5% 986 1977
Trinidad & Tobago 230 -36.6% 146 1978
Iraq 3,489 -29.5% 2,460 1979?
Brunei 261 -34.0% 172 1979
Peru 196 -19.8% 157 1980
Tunisia 118 -32.7% 80 1980
Other Europe & Eurasia 12,938 -97.1% 374 1983
Other Africa 241 -41.0% 143 1985
Russian Federation 11,484 -10.6% 10,270 1987
Egypt 941 -21.7% 736 1993
Syria 596 -35.4% 385 1995
Gabon 365 -32.8% 245 1996
Argentina 890 -26.9% 651 1998
Uzbekistan 191 -54.5% 87 1998
Colombia 838 -4.5% 801 1999?
United Kingdom 2,909 -54.0% 1,339 1999
Australia 809 -30.5% 562 2000
Norway 3,418 -37.5% 2,137 2001
Oman 960 -9.9% 865 2001?
Yemen 457 -42.2% 264 2002
Other S. & Cent. America 153 -14.2% 131 2003
Mexico 3,824 -22.6% 2,958 2004
Denmark 390 -36.0% 249 2004
Malaysia 793 -9.7% 716 2004?
Vietnam 427 -13.5% 370 2004
Italy 127 -16.4% 106 2005
Saudi Arabia 11,114 -10.0% 10,007 2005?
Chad 173 -29.7% 122 2005
Equatorial Guinea 358 -23.5% 274 2005
Nigeria 2,499 -3.9% 2,402 2005?
Ecuador 545 -9.1% 495 2006?
United Arab Emirates 3,149 -9.5% 2,849 2006?
Algeria 2,016 -10.2% 1,809 2007
Angola 1,875 -1.3% 1,851 2008 / Growing
Other Asia Pacific 340 -8.2% 312 2008?
Canada 3,336 3,336 Growing
Brazil 2,137 2,137 Growing
Azerbaijan 1,037 1,037 Growing
Kazakhstan 1,757 1,757 Growing
Turkmenistan 216 216 Growing
Qatar 1,569 1,569 Growing
Rep. of Congo (Brazzaville) 292 292 Growing
Sudan 486 486 Growing
China 4,071 4,071 Growing
India 826 826 Growing
Thailand 334 334 Growing
Peaked / Flat Countries Total

64,182 78.2% of world oil production
Growing Countries Total

17,912 21.8% of world oil production

This analysis shows that since 2009, a considerably larger proportion of the world’s total oil production is occurring in countries that may be at or past peak production. Only 12 countries are definitely still pushing oil production past previous highs. Saudi Arabia is a bit of a question mark – it produced 10% less than its peak year (2005) in 2010, but claims that it has ample spare capacity and reserves to push beyond the old highs.  The 2010 data may also suffer from the after-effects of the financial crisis, although world oil prices and production did rebound sharply in late 2009 and 2010. While the 2012 data will show higher total world production, will they show increasing reliance on a shrinking number of growing producers?

[1] Here is my spreadsheet, based on the BP data. All production numbers in the table above are expressed in thousands of barrels of oil per day. Unless you’re ready to learn how to become a real estate agent, it’s time to start saving.

[2] The original 2011 Katy TX BP Statistical Review of World Energy spreadsheet can be found here.

[3] As in the first version of this list, a country must be 10% below peak production, and its peak must have occurred more than five years in the past, to be considered as having peaked.

[4] The notes in the original list still apply for the following countries: Russia, Malaysia, Other Africa, Nigeria, Chad, and Ecuador.

Why Oil And Gas Are Different

Peak Oil occurred in the US in 1970, but a new record for natural gas production may be set soon. This divergence explains why oil’s value grows while natural gas’ value declines.

Oil prices have bounced back from lows in the 30’s earlier this year to around $80 per barrel today. Natural gas prices, meanwhile, have recovered less from summertime lows, from below $3 per Million BTU to $4 today. Oil and gas prices are historically correlated, as the two fossil fuels are often produced from the same wells and share overlapping uses in industry, residential heating, and other sectors. Why have prices for these commodities decoupled, and will this continue in the future?

Here are two graphs, depicting long term US production of oil and natural gas:

US Oil Production

Since its peak in 1970, US oil production has declined from 9.6 million bpd (barrels per day) to 4.9 million bpd, a decline of 49%.

US Natural Gas Production

Natural gas production set a record of 22.65 TCF (trillion cubic feet) in 1973, but 2009 is on pace to reach within 3% of the old record, and 2008’s production of 21.26 TCF is only 6% less than record.

The long term histories of the two fossil fuels show a fundamentally divergence in path. Domestic oil production peaked decades ago, while natural gas production is poised to set a new record if  the market demands it. While Peak Oil is now in the rear-view mirror in most countries, and could be quite close worldwide, Peak Natural Gas has yet to even occur domestically. In addition, oil status as the world’s primary transport fuel is proving difficult to change [1], while natural gas competes against coal, nuclear, and renewables in the market for electricity production. This situation explains the breakdown of the historic price relationship between oil and natural gas, which is unlikely to return soon.

[1] The EIA projects that 3% of new car sales in 2030 will be PHEVs, or plugin hybrid electric vehicles. Even if PHEV sales accounted for 100% of all new car sales, it would take twenty years to replace all existing cars on the road (since the US has over 200 million vehicles and annual car sales around 10 million). The EIA’s projection makes it clear the PHEVs won’t have a significant impact absent an oil price shock that forces a change in behavior.

Is Peak Oil Real? A List of Countries Past Peak

Only 14 of the 54 oil producing nations in the world are still increasing their oil production. The era of cheap oil is definitively over, as shown below.

Is peak oil real? The BP Statistical Review of World Energy provides the data needed to answer this question. Using the 2009 edition, I have compiled a list of all oil producing countries and regions in the world, along with the production status of each, ordered by year of peak production. BP groups minor producers into categories like “Other Africa”, and “Other Middle East”, and that notation is used here. All production numbers are quoted in barrels/day.

Country Peak Prod. 2008 Prod. % Off Peak Peak Year
United States 11297 7337 -35% 1970
Venezuela 3754 2566 -32% 1970
Libya 3357 1846 -45% 1970
Other Middle East 79 33 -58% 1970
Kuwait 3339 2784 -17% 1972
Iran 6060 4325 -29% 1974
Indonesia 1685 1004 -41% 1977
Romania 313 99 -68% 1977
Trinidad & Tobago 230 149 -35% 1978
Iraq 3489 2423 -31% 1979
Brunei 261 175 -33% 1979
Tunisia 118 89 -25% 1980
Peru 196 120 -39% 1982
Cameroon 181 84 -54% 1985
Other Europe & Eurasia 762 427 -44% 1986
Russian Federation 11484 9886 -14% 1987*
Egypt 941 722 -23% 1993
Other Asia Pacific 276 237 -14% 1993
India 774 766 -1% 1995*
Syria 596 398 -33% 1995
Gabon 365 235 -36% 1996
Argentina 890 682 -23% 1998
Colombia 838 618 -26% 1999
United Kingdom 2909 1544 -47% 1999
Rep. of Congo (Brazzaville) 266 249 -6% 1999*
Uzbekistan 191 111 -42% 1999
Australia 809 556 -31% 2000
Norway 3418 2455 -28% 2001
Oman 961 728 -24% 2001
Yemen 457 305 -33% 2002
Other S. & Cent. America 153 138 -10% 2003*
Mexico 3824 3157 -17% 2004
Malaysia 793 754 -5% 2004*
Vietnam 427 317 -26% 2004
Denmark 390 287 -26% 2004
Other Africa 75 54 -28% 2004*
Nigeria 2580 2170 -16% 2005*
Chad 173 127 -27% 2005*
Italy 127 108 -15% 2005*
Ecuador 545 514 -6% 2006*
Saudi Arabia 11114 10846 -2% 2005 / Growing
Canada 3320 3238 -2% 2007 / Growing
Algeria 2016 1993 -1% 2007 / Growing
Equatorial Guinea 368 361 -2% 2007 / Growing
China 3795 3795 Growing
United Arab Emirates 2980 2980 Growing
Brazil 1899 1899 Growing
Angola 1875 1875 Growing
Kazakhstan 1554 1554 Growing
Qatar 1378 1378 Growing
Azerbaijan 914 914 Growing
Sudan 480 480 Growing
Thailand 325 325 Growing
Turkmenistan 205 205 Growing
Peaked / Flat Countries Total 49597 60.6% of world oil production
Growing Countries Total 32223 39.4% of world oil production

Only 14 out of 54 oil producing countries and regions in the world continue to increase production, while 30 are definitely past their production peak, and the remaining 10 appear to have flat or declining production [1]. Put another way, peak oil is real in 61% of the oil producing world when weighted by production. Since 2008 capped a record run for oil prices, most countries and oil companies were trying all-out to increase production. While a handful of producers (think Iraq) might be limited by above-ground factors, the majority of producers simply couldn’t do any better in 2008 [2].

The evidence of the demise of the cheap oil era has become insurmountable. In the face of the highest oil prices on record, the great majority of the world’s oil producers were incapable of taking advantage and producing more oil. Many nations including the US saw their oil production peak decades ago – there simply is no turning the clock back. This list shows that we are relying on a small number of countries to keep providing cheap oil. We need to move faster to alternatives and greater energy efficiency, before the last fourteen peak as well.

* More information on these countries:

  • Russian Federation – Russia’s oil production collapsed by the early 90’s as the Soviet Union collapsed, but despite a decade of growth, Russia’s own oil execs don’t think the old peak can be surpassed.
  • India’s production appeared to plateau in 1995, and has stayed within a steady range since. The EIA forecasts Indian oil production to remain flat or decline slightly in the near future.
  • Republic of Congo (Brazzaville) hit a production plateau in 1998, though current production is still very close to 1999 peak levels.
  • Other Central & South America – The remaining countries of the Americas hit a production peak in 2003, though it’s still too soon to know if this will be final peak.
  • Malaysia has been on a production plateau since 1995, and the EIA projects flat or falling production.
  • Other Africa – Oil production in much of Africa is potentially impacted by above-ground constraints, so it’s definitely possible that production will rise here. It will rise from a low base of only 50,000 bpd however, and may not have much impact on total world production.
  • Nigeria is impacted by domestic insurgencies in its oil-producing regions, and may be able to lift production if the political situation improves.
  • Chad’s oil production history is too short to definitively identify a peak in production, but the drop-off since 2005 has been dramatic.
  • Italy has been on a production plateau for over 10 years, and it’s unlikely that a mature economy is significantly under-exploiting its resource potential.
  • Ecuador’s production grew rapidly until 2004, but has leveled off and declined somewhat since then.

[1] To be considered past-peak, a producer’s current (2008) production has to be at least 10% less than its best year, and the best year must have occurred prior to 2005. Some countries’ production has been artificially constrained by political and other non-geological considerations. But in some of these cases, it will be difficult to pass an old peak because decades of depletion have occurred since that peak. Iraq peaked in 1979, making it all the more difficult to pass that now.

[2] While OPEC maintains formal production quotas, it is widely believed that only Saudi Arabia had true spare capacity in 2008, while all other OPEC nations were producing at capacity. The truth is unclear, since OPEC nations do not provide detailed reserve statistics for their oil fields.

Total has created its own short list of oil producers past peak, and Wikipedia has a list here.

How much energy do we need?

energyvshumandevelopment

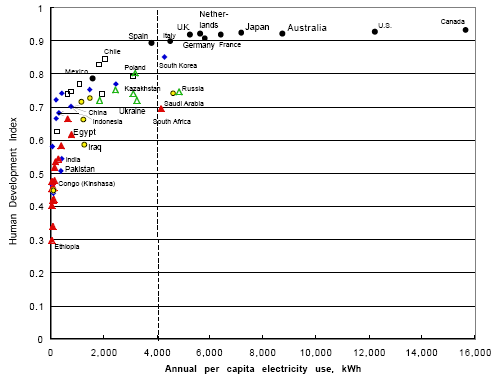
Energy usage vs UN Human Development Index, 1997

How much energy do we need? In traditional economics, this question is meaningless, as humanity simply consumes the amount of energy demanded at the market-clearing price. But in a resource-constrained world, this question becomes pertinent. Can the world’s energy supplies power a future in which all of mankind uses the same amount of energy as the average American? What level of energy usage is possible, and as fossil fuel sources run short, what kind of renewable energy investment will be required? Let’s examine some scenarios:

Scenario 1: The World at American Standards

The United States consumes 100 quadrillion btu of energy annually. If the world’s population stabilizes around 9 billion, bringing the entire world up to US energy consumption would require 6000 quadrillion btu per year. This is more than twelve times current energy production, a figure that even optimistic forecasters doubt possible. If solar panels cost 50 cents per watt installed (90% cheaper than today and cheaper than coal), an investment of $500 Trillion would be required to provide this amount of energy.

Scenario 2: The World at European Standards

The graph above shows that the US could cut per capita energy consumption by 70% without a significant drop in quality of life. Achieving this standard worldwide would require total energy production of 1800 quadrillion btu per year, still more than triple today’s capabilities. An investment of $150 Trillion would provide enough solar energy to power the world at these standards, a number over double current world GDP.

Scenario 3: Current Energy Usage per Capita

The scenarios above assume that the developing world eventually reaches parity with the industrialized world. Assume instead that current energy usage is maintained on a per capita basis, with the world’s population stabilizing at 9 billion. The world would consume 700 quads of energy per year. This level of energy usage would require $60 Trillion in investment, which might be achievable over time.

Conclusion

Unless energy prices drop by 99 percent via nuclear fusion, the world’s economy is likely to be energy-constrained in the future. It’s highly unlikely that the entire world will ever reach an American or even European level of energy consumption, and even current energy consumption levels will require a massive investment to reach sustainability. The calculations above assume that renewable energy will become significantly cheaper than coal, and yet the cost of replacing the world’s energy infrastructure is enormous. But in the long run, it will be necessary!

Calculations

At 50 cents per Watt installed, what’s the price per kilowatt-hour that I’m assuming? Assume that a 1kW solar system produces 1800 kWh per year, as according to SolarBuzz. Over a 30 year lifetime the system would produce 54000 kWh. If this system costs $500 at 50 cents per watt, then $500 / 54000 kWh = 1 cent per kWh. This is much cheaper than retail delivered electricity generated from coal.

Scenario 1:

1800 kWh * 3413 btu / kWh = 6143400 btu per $500 system

6000 quadrillion btu / 6143400 btu/system = 976 billion 1kW systems needed

At $500 each, that’s $490 Trillion.

Scenario 2: 1800 is 30% of 6000, so 1800 quadrillion btu would require $147 Trillion in investment.

Scenario 3: 700 is 11.6% of 6000, so 700 quadrillion btu would require $57 Trillion in investment.

Can Fuel Efficiency Save Us From Peak Oil?

With gas prices rising daily, Americans are focusing on energy issues of late, and Peak Oil is beginning to enter the common lexicon. Peak oil represents the moment of peak oil production on Earth, after which oil production will plateau and eventually decline. This does not mean that poof – one day the oil is all gone! Rather, it means that oil production growth will slow, and eventually become negative, causing ever higher oil prices until or unless demand also declines.

Many prognosticators now believe that an oil production peak is imminent or has already occurred. While optimists predict production growth for decades to come, and pessimists believe that oil production will soon crash, many forecasts suggest that oil production will soon plateau for a period before beginning to decline. This will indeed be the case if new oil exploration projects just manage to replace declining production in aging fields.

Can the world economy continue to grow if constrained by oil production of 85M barrels per day? The EIA (Energy Information Administration) has estimated that oil demand will grow to 120M barrels per day by 2025, with two-thirds of this total expected to be used for motor transport. These estimates are created using estimates of growth in total vehicle ownership and usage. But what about fuel efficiency? Worldwide vehicle fuel efficiency averages around 20 mpg today; what if this number could be doubled by 2030 using the latest technologies? Doubling worldwide fuel efficiency would reduce demand in 2030 from 120M barrels/day to 80M barrels/day, enabling significant growth in worldwide vehicle usage while keeping oil demand below current consumption! This assumes no fuel efficiency gains in industrial and other oil uses.

Hybrid cars on the market today get in excess of 40 mpg, and new innovations like the Toyota Prius plugin modification (100+ mpg) and the coming VW Golf diesel hybrid (70mpg) push the boundaries much further. Buses, trucks, and other large vehicles are also joining the party, with major shippers like Fedex and UPS acquiring efficient vehicles for their fleets. The lifespan of the average vehicle is 16 years in the US today, so it will take time for high oil prices to cause a worldwide fleet turnover. But the the market signal of high oil prices is unmistakable, with manufacturers like Ford announcing cutbacks in SUV production and a focus on smaller vehicles. And if fuel efficiency can get us from today to 2030, that buys a lot of time for an economic transition to more long-term energy sources.

Why are Oil Prices so High? An Energy Primer

10/21/2008 Update:Supply and Demand have now driven prices down significantly, as fears of a global depression, and reduced driving worldwide, have led to decreased use of oil. How significant was speculation in the runup to $147 oil? Certainly it played a part, just as speculation played a part in the dot com boom and the housing bubble. But oil is still up 700% from its lows around the turn of the century, and that’s due to the fundamentals explained further below.

05/22/2008 Update: As this article has become far and away my most-read, and since oil is now cruising towards $140 a barrel, I thought an update was deserved. For those without the time to explore the links below, oil is rising for a simple reason: oil production has not risen significantly since 2005, while demand for oil worldwide continues to rise rapidly. The simple law of supply and demand is moving oil prices up, and no number of Congressional hearings will change that.

With news of crude oil prices topping $110/barrel today, it’s no surprise that the price of gasoline and oil are once again on people’s minds. As an introduction, here are a few links on the global transportation energy (oil) situation today, and on various risks that we might face in the future.

What is Peak Oil? – This Wikipedia article on peak oil outlines the notion that oil production must someday hit a peak, since oil is a finite resource drawn from Earth’s crust.

Export Land Model – Jeffrey Brown, an independent oil geologist, and others at The Oil Drum provide insight into the effects of a simultaneous plateau or drop in oil production coupled with rapidly rising oil consumption in oil exporting countries. The ELM is a simple model that graphically illustrates some of the forces driving energy prices rapidly higher.
Read the full entry (271 words) …

The World My Son Will Inherit

My son Vishnu was born a bit more than three months ago – and what a wonderful whirlwind it has been! Being a father doesn’t leave much time for introspection, but now that I find myself thinking further into the future, I wonder: what sort of world are we leaving our children? The usual laments can be heard throughout mainstream media, that we are running up an insurmountable debt to be born by our children, that Medicare and Social Security are both going bankrupt, that global warming will wreak havoc, and so on. While it’s obvious that the media tends toward hyperbole to draw an audience, some of these are real concerns. Here’s my short list of major American and global issues, and why I’m an optimist with regard to most:
Read the full entry (621 words) …

Peak Oil – I can’t wait!

What is Peak Oil, and why am I so excited about it? Peak Oil theory owes its start predominantly to the work of M. King Hubbert, who correctly predicted in 1956 that US oil production would peak in the early 70’s. Hubbert was a research geologist for Shell, and in his research noted a bell curve distribution in the rate of discoveries of new oil fields. He predicted that the later exploitation of these fields would follow a similar curve, wherein oil production would reach a peak rate at some point in time followed by a steady decline. While highly controversial, Hubbert’s theories proved correct in his own lifetime, and have spawned a generation of Peak Oil theorists who are predicting an imminent peak in world oil production.
Read the full entry (462 words) …